Category Archives: Three Creative Hours

Turning ideas into reality, three hours at a time.

Week 14/15: The spine tingler

What if the scary book you were reading could really shock you?

This piece of biofeedback-based experimental book art detects the rising fear or excitement in a reader and then amplifies it, by causing tingling in the hands through to mild electric shocks. This effect is created by a wrap-around book cover that can sense the physiological changes that occur when a person sustains fear or other arousal, and then responds by injecting a small electric current through the book jacket and into the hands.

Important note: Those who suffer from heart conditions, who wear a pacemaker, are epileptic, pregnant, or undergoing cancer treatments should not use this device. (It works at low enough levels that it should be safe for those people but I am not familiar enough with all makes of cardiac implants and other therapies to guarantee safety.)

The Spine Tingler in use

In essence, the book jacket acts as a lie detector. (Lie detectors don’t detect lies, but they do effectively measure increased activity of the sympathetic nervous system—the fight or flight response.) When you read something that excites you, your sympathetic nervous system ramps up leading to the galvanic skin response, in which the electrical resistance of the skin changes. The response kicks in with fear, anger, being startled, or sexual feelings.

When the device measures the increase, it switched mode to send an electrical current proportional to the level of sympathetic nervous system response through the book cover. It starts out feeling as a very slight tingling, increasing to enough of a shock that most people would naturally recoil from it, probably dropping the book.

How it works

The first stage of the Spine Tingler algorithm is to detect the galvanic skin response. This is achieved through use of a home-made combination resistive and capacitive touch panel. It consists of one sheet of conductive polymer and two sheets of striated conductive polymer—conducting plastic—separated by a very thin sheet of non-conductive plastic. (The capacitive touch panel is similar in principle to the iPhone touch screen but not quite the same.)

Continue reading Week 14/15: The spine tingler

Week 13: The etolemur

This one is just for fun. I had an electric razor which had died and wasn’t really repairable. After having a hard time breaking inside the thing, I managed to dissect it completely and have reformed the parts into what I am calling my etolemur, because of a very vague resemblance to an otolemur.

I didn’t reuse all the parts but all the parts of this little guy came from the razor. My favorite parts are the eyebrows and the super-sharp claws. He also has some extra talons out the front but those are primarily due to his need to defend himself against creatures made of bigger and better electronic equipment. His ancestors were picked on a lot so evolution has given him a couple of extra advantages for survival.

He’s not great at standing on his hind legs unassisted so he uses his tail for support when showing off like this. His arms are pretty agile and springy, which are of great use both in launching himself from branch to branch and as shock absorption when he takes a rough tumble when playing with his other etolemur pals.

Week 12: What is a magazine?

An essay for this entry that starts as follows and continues at Cathemeral Thinking:

As I work toward launching a new magazine, I am contemplating a question that seems to have an obvious answer to many people, but is definitely contentious, and for which there is no real consensus. Although finding a concrete answer might also seem like a philosophical pursuit of no real importance, I think it is pretty important to be aware of what I am about to do. I should probably already know the answer to this as editor-in-chief of one magazine that I built, but the changing publishing landscape prompts me to re-examine it. Knowing what makes a magazine also gives us a chance to emphasize what is characteristic and gives us hints as where we could focus our efforts.

Week 10/11: The TwitterLamp

“This micro-knowledge of others has been termed ‘ambient awareness’ by sociologists, a new kind of social proprioception or ethereal limb, and I learned to flex it with ease.”

New York magazine, April 5, 2009, regarding Facebook status updates

We are bombarded with information, most of which we have relatively little conscious awareness of as we go about our everyday lives. Signs, advertisements, piped music, and video displays all litter our environment, coming into our conscious minds typically only as we need or want the information presented by those sources. And yet, we still pick up some sense of what is happening through their ambient presence.

Recent Web tools make this idea of ambient information presence a little more explicit (and more useful) through sources like a Facebook news stream, or a twitter stream. By simply scanning these sources, we are able to get a sense of the lives of groups of people. With these tools we get a sense not through partial reception of the information, as for environmental background sources, but through partial information supplied in these streams.
However, these new Web tools also exist primarily through interfaces that require conscious actions to access. How do you know what is happening in your streams without going to a Web site, mobile device, or some other interface? Some desktop twitter clients play a sound or show an alert for updates, but that is a fairly intrusive action, and can be distracting. How can you gain a semi-conscious sense of twitter activity?
I wanted to play with this idea of ambient awareness further and create something that gives a purely ambient sense of stream activity.
The TwitterLamp

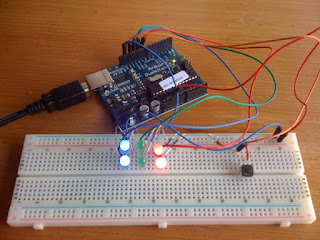
The device I decided to create monitors my twitter stream and lights up different colors depending on the levels of status updates, @replies, and direct messages in my stream. The three color channels (blue, green, and red) light up at different intensities depending on how many new updates there have been since the last reset. A press button resets the counts.
The TwitterLamp will sit your desk glowing more intensely blue as more updates arrives, more green as you get more @replies, and with more red in the mix as you get direct messages. To make the simplest version, I decided to run this via a USB cable to the computer, which will supply power and the data needed to light the lamp.
Some features
– The color channels can be reassigned easily.
– The color channels can be modified to trigger from other kinds of levels such as occurrences of words in an RSS feed, number of new emails present in various email accounts, etc.
– The intensity can be scaled depending on your twitter activity. For example, if you only get the occasional direct message but you care about them a lot when they arrive, direct messages can turn the red channel to full intensity, whereas the blue updates might require a few hundred updates to reach full intensity.
– Updates can be scheduled at whatever intervals you choose so as not to use up the regular allotment of 100 API calls per hour.
– The hardware is small so it can be mounted inside various kinds of lamps. The one shown above is a blown glass lamp from IKEA. That particular lamp is larger than I would have chosen but it was there and handy, so I decided to use it for the prototype.
How it works

Building a device like this from scratch would take considerable effort but modern microprocessor hardware is incredibly powerful and easy to use. I decided to use the Arduino platform for the hardware, with the closely integrated Processing programming environment for running the code. 
The hardware is shown in the photo to the right. It’s really pretty straightforward, with the Arduino board connected via a USB cable to my computer, with the solderless breadboard there for prototyping, with a few LEDs and a pushbutton switch. For best brightness with the components I had on hand, I used pairs of each color of LED. In the image, the blue and red are illuminated to indicate the presence of new friend updates and some direct messages. The green LEDs are turned off because there are no @replies at that time of the photo. 
The Processing code uses the twitter4j library to access the Twitter API and read the streams. It determines how many updates are in the streams, changes the appropraite levels and sends those levels out through the USB connection. It also constantly monitors for a button press, ready to reset the counts as needed. The code can compile to a standalone lightweight java application that runs unobtrusively but also gives numerical counts of the updates, with times to the next updates, if you choose to open the app.
The Arduino code does the conversion from the data coming from the computer and illuminates the LEDs in response. It also monitors the button and sends the reset signal back to the Processing code.
Possible updates/improvements
– Make a version of this using the blinkM programmable LED (it’s overkill but means that little hardware beyond the Arduino and the blinkM are required). That will require a different programming protocol. Using the blinkM would also make it very easy to intergrate other types of information such as a pulsing or color variation to indicate information beyond the three basic channels.
– The button can be wired so that pressing down on the light causes a reset instead of having a regular button that needs to be pressed.
– The TwitterLamp could communicate wirelessly with either your own laptop, or via a Web server, and operated on batteries or a powerpack so that it isn’t tethered to a specific computer.
– The current system counts updates only from when the Processing code is started. A future version will store the most recently accessed information in the Arduino or in a file on the computer so that switching it on will immediately show updates since the TwitterLamp was last operated.
– Add a fourth yellow channel for new followers. (This might be a little odd as it’s not really an independent color from RGB, but perhaps specific physical placement within the globe might allow this to be differentiated–a spot at the top of the globe, or a yellow rim of light around the bottom, perhaps.)
– The software currently operates using the twitter4j library, which is most useful for me because it handles the authorizations very easily. However, some of the functions don’t seem to be working properly within Processing because, I think, the twitter4j library relies on a version of java more recent than is implemented in Processing. If I figure out how to do the authorization myself, I’ll just use the twitter API direct. (I had never programmed in java before this project so I’m not quite up to handling the authorization process yet! Last time I programmed was 15 years ago so the whole world of programming on the Web is new to me.)

Week 9: A return to electronics–setting up

As a kid, I used to spend a lot of time inventing and building electronic circuits. I could have told you immediately that yellow-violet-orange meant a 47 kilo-ohm resistor. Alas, those details have slipped into the murky depths of time, but I have regained an interest in electronics recently because I’ve seen how powerful and easy-to-use modern microprocessors are.

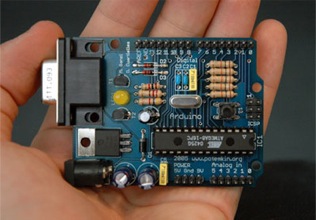
In particular, I’ve been looking into the Arduino microprocessor (shown right) as the core of a few applications I want to build. 
But before I leap into more complex projects, I want to re-acquaint myself with building electronic circuits again. All of my electronics gear is back in Australia so I needed to do quite a lot of shopping to get myself all set up again. After a very long time spent wandering the confusing aisles of Fry’s (the handiest place for this kind of gear, even if not the best), I came home with quite a haul.

As a starting point, I just wanted to have a reliable 5V power supply available for building circuits. This should be easy (and is in hindsight), but it took a while to figure out precisely how to do it. I opted for an off-shelf power adaptor that has a switch to select voltages in 1.5V increments up to 12V. 
I grabbed a prototyping breadboard to build the circuits on, and a handful of components to have a properly regulated power supply. The cheap power adaptor has settings for 4.5V and 6V but nothing for 5V so I definitely needed to do something to give a reliable 5V supply. Of course, those settings are very loose as it is and if you measure the voltage across the supply without any load or a very small load, the actual voltage is much higher than that stated. 
The first problem was getting power from the power adaptor to the breadboard. I found a convenient socket for a power adaptor cord that I could attach a couple of wires to the back off and run them to the power terminals on the breadboard. That way I didn’t need to hack apart anything in the power adaptor and I can still use it for other purposes.
With power to the breadboard, I just needed to regulate the voltage. The solution was the very convenient LM7805 voltage regulator (which only took me 20 minutes to find at Fry’s because they have a supplier that relabels everything in some obscure code that I only deciphered once finding a full catalog).  You can essentially apply any voltage from 7-20 volts or so to the chip, and pull off 5V+/-0.25V. Add a few capacitors on the input and output sides of the chip to smooth out the voltage under load, and it’s all set. 
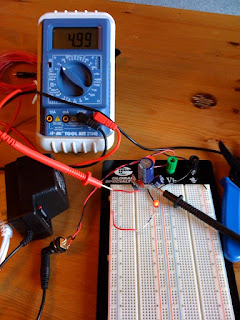
Just to test there was power working properly, I just drove a single LED (via a resistor to avoid the characteristic pungent smell of frying electronics that I recall from undergraduate laboratory classes). And here is the result. As you can see, the LED is lit and my digital multimeter is showing a voltage of 4.99V. A perfect start to getting back into electronics.

Next was a simple circuit to make sure I have things working. Using the classic 555 timer integrated circuit, I decided to make a small sound generator. It produces a sawtooth pattern with the frequency depending on the values of resistors and capacitors in the circuit. I don’t have very many components on hand so I had to steal the capacitors from the voltage regulator for now, and just used the resistors I had to hand, but the frequencies come out in the audible range and different resistors do indeed create different tones.
Yes, this is a pretty boring outcome so far, but it’s amazing how much I am re-learning just in the process of getting all the gear together and setting it up! My Arduino board should be arriving soon, and I have the Processing language installed and I am playing with it so that I can make my computer talk to the microprocessor, all on the way to a fun application I’ll write about as I get further along.

Week 8: How twitter might change news

Well, I’m not exactly keeping up a weekly project every week but I thought I might as well number sequentially and in some weird dream land I might catch up to the actual week number… but anyway…

This week, the creation is another essay. It might seem like cheating a little but I think that writing this particular analysis was creative in its own way. I absorbed myself in a process and learned a lot and then created by distilling it.

Essentially I watched a news story break over twitter, and then inspired by a comment about the fast news cycle, started to think about the implications for how people will react to conventional fast-breaking news stories in the future. I asked a question about it, which provoked some discussion, and that led to me fleshing out my thoughts in this essay.

The essay is over on Cathemeral Thinking but this is how it starts:

On Thursday morning (US Pacific Time), March 12, 2009, a piece of debris came close enough the International Space Station to require the astronauts to take refuge in the Soyez module, just in case there was a collision. In the end, the debris passed by without incident.

I experienced this event almost entirely through twitter. This essay is to share my experience about how this is an example of ways in which somebody can follow news in a format completely different from conventional news reporting. This experience is, obviously, peculiar to me, in that only I follow my set of twitter users, and this is my personal reaction to it. However, I believe that this kind of process is starting to occur for many more people and it changes the way those people will use conventional news reporting.

For the rest, jump over here.

Week 7: Blurt communication

Not much introduction for this one as it the product is an essay. However, it is based on spending a lot of time in the past week or so getting to understand twitter and how it can be useful, and playing the signtific game “Free Space” during the week.

The confluence of various activities I’ve been involved with and the conversations I had at the AAAS meeting in Chicago brought many ideas into my head all at once. One way this has manifested is the essay: “Blurts: The value of short, rapid, open communication to collective creativity”
Comments encouraged!

Week 6: Elementary exercises in type

Who’d have thought three hours per week was hard to find? I could have easily made it today except that I spent most of a day beginning to catalogue my books, courtesy of a barcode scanner I acquired during the week, and the very useful goodreads.com. If you want to know what I have on my bookshelves, feel free to take a peek.

While I was digging through my books, I came upon the most excellent The Elements of Typographic Style by Robert Bringhurst. The book itself is beautifully designed and printed, and has more information about typography than you could absorb in a long time of study. Picking it up I recalled that it had a list of the traditional names for the different sizes within a typeface tucked into the margin of a page. I figured that I could play with them a little as an exercise and set a guide to type sizes.
Because these are older names for typefaces, I thought a fairly traditional typeface would be best, and having spent some time reading The New Yorker earlier today, decided that Caslon would suit well. I had Adobe Caslon available so used it.
I chose to set this in a 5″x3″ format, with the constraint that I wanted to be able to print it on a laser printer directly onto an index card. That meant 0.5″ margins, which definitely constrains some approaches to playing the text, especially with respect to a title for the card.
So that a right-handed person would hold and turn the card easily, I ran the title down the right hand side of the card. A 14-point font meant the title ran the height of the main text block, so I used that for balance.
The automatic leading set by InDesign didn’t quite feel right because of the mix of ascenders and descenders so I tweaked that a little to get a good vertical sense of rhythm down the lines, although I’m not sure I have it quite right. 
Using the text figures in the left column didn’t feel right with the standard settings so I needed to kern them a little tighter, or else the 10 seemed to stretch far too wide, especially in relation to the 11 below. The mix of ascenders and descenders was particularly challenging to deal with so I had to hang the occasional numeral a little higher or lower. I also played with using titling figures but they just swamped the text given that I set it all lowercase.
And so, at the end of the playing, we have a 5″x3″ index card with the old-fashioned names of the font sizes. I suspect that a real typographer could do a lot better but this is all about learning!

Week 5: A numerical photographic tour of SLAC

This week’s project has been in progress for a little while already but I spent a few hours playing with it this week. 

A couple of years back, an excellent photographer Satoru Yoshioka visited SLAC to take photos for his portfolio. Since then he has been named Best Science Photographer of the Year 2008 by a British photographic society, for his portfolio of work from many of the world’s high-energy physics labs. But back when he took photos, I was very taken by his spare style and spent a long time looking at his photos. I noticed in a few photos something that stood out. Many of the locations and facilities at SLAC have numbers painted, engraved, or somehow imprinted on them. And that had some appeal to me that I couldn’t quite explain, but I found it interesting.
And so the idea was born: I wanted to create a tour of SLAC by the numbers. I would take a set of photographs on the site of SLAC, each outdoors and containing a number, and then pin them all to a Google Maps layer so that somebody could click through in numerical order or just dash around the virtual site and see a different view of the lab.
I make no claims to being a good photographer. This is more a proof of principle project.
I haven’t found all the numbers yet but have posted a bunch of them in a custom map, without any of the real bells and whistles that the Google Maps API would allow, but it’s a start.
As time goes on, I’ll find more numbers and add more photos, but here it is for now:


View Larger Map